Create a custom webmap with custom raster overlay from multiples PNGs
17 Dec 2016This post will show how to built a custom webmaps from a massive amount of PNGs.
To do that we will use only free softwares:
Apart from production pipeline we also will use QGIS during development phase to check intermediate results.
Problem to solve
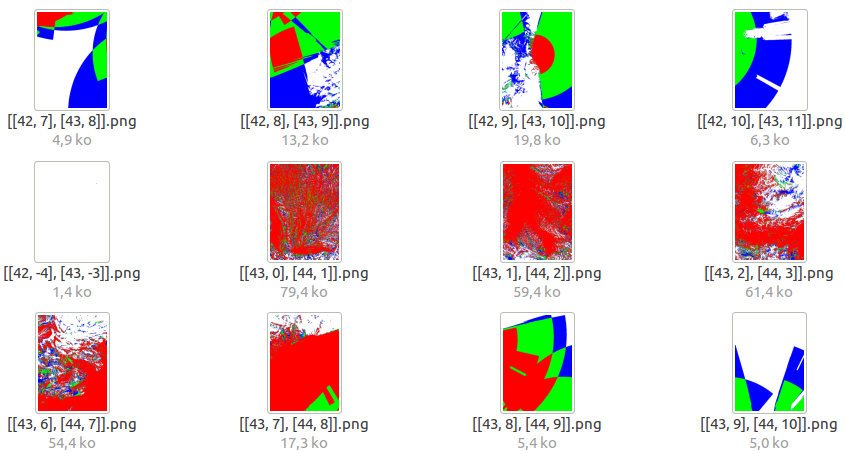
Basically, we have a lot of PNG files containing data in a one degree by one degree size.
Each PNG represent Sigfox radio coverage on a area of 1degree by one degree in GPS coordinate system.
Consequently, images does not have the same size :
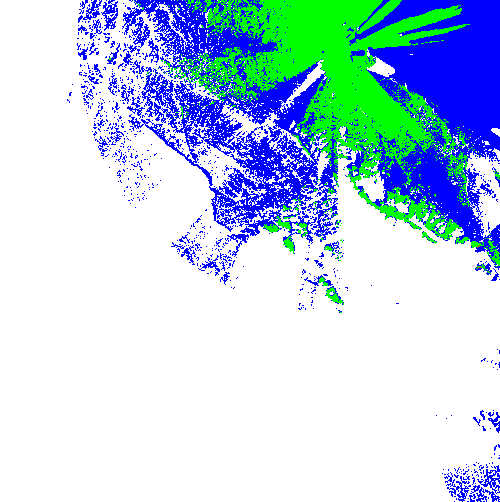
All these images are named with lat long corner information and spread accross several directories.
One more difficulty is that coverage are stored by country and there is overlaping images on borders. We will need to merge images near borders.
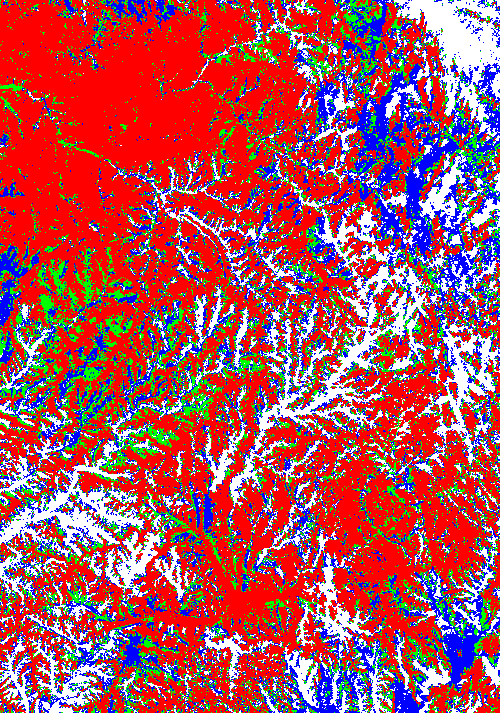
Colors are pure Red Green Blue representing several levels of radio coverage. We will change all colors into a single one for a less complex and more aesthetic map.
Goal to reach
We will create a webmap with outstanding performances:
A fully cached web maps tiled and served within TMS urls.
Url like this
http://.../Z/Y/X.png
Will return 256px x 256px PNG tile with alpha like this:
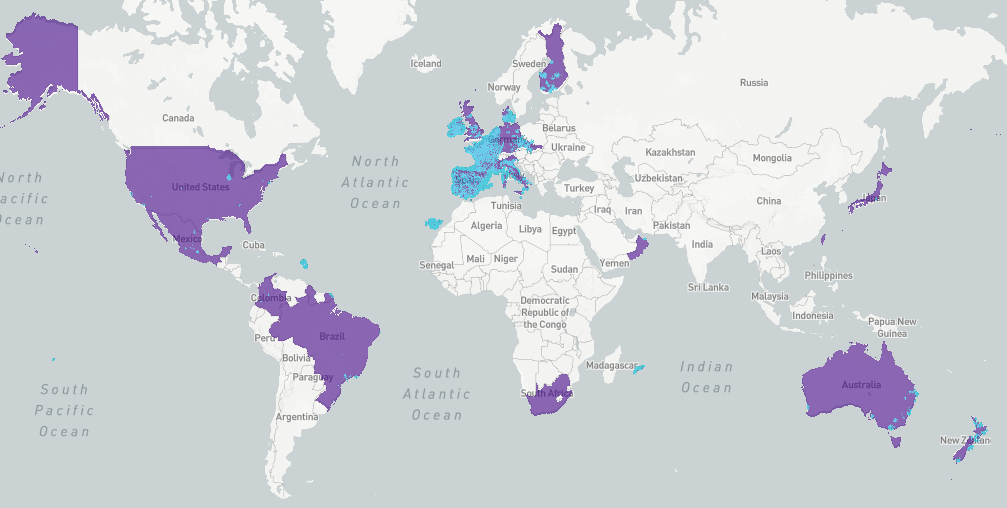
Finally we will put in on a webmap using leaflet and with a nice background:
Principle
The general principle follow several steps:
- Change color channels to merge Red Green Blue into one channels
- Merge overlapping images
- Add geographical data into images transforming PNGs into geotiff
- Remove geotiff RGB palette
- Build an Image pyramid from Geotiff images
- Transform images in pyramid into 1 color band images
- Loading images into Geoserver
- Finalize layer style: apply final color, merge with other layers
- Build TMS directory tree with Mapproxy
- Serve tile from this directory with NGINX
- Built a leaflet map on a webpage
Note: Maybe it is possible to skip one step (especialy color manipulation) but all attempts I made failed
I won’t present the python & bash script glue but only important commands and tools.
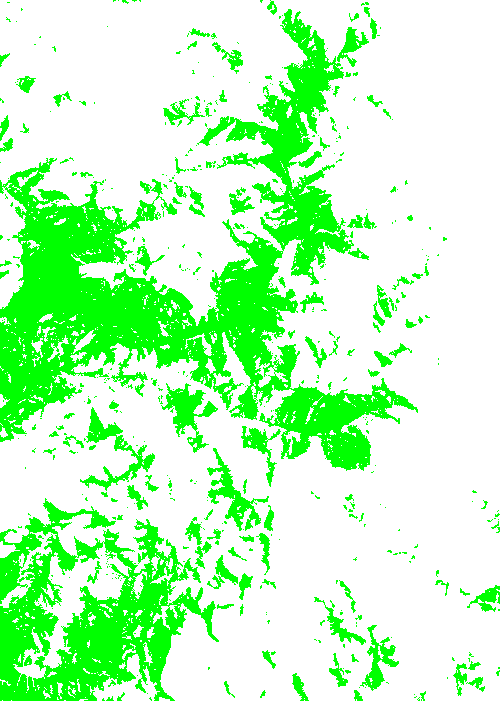
Change color channels
As said in introduction, we want a one color coverage map.
That is why we change blue and red into green (to have a single color) with convert command:
convert input.png -fill "#00FF00" -opaque blue tmp.png
convert tmp.png -fill "#00FF00" -opaque red output.png
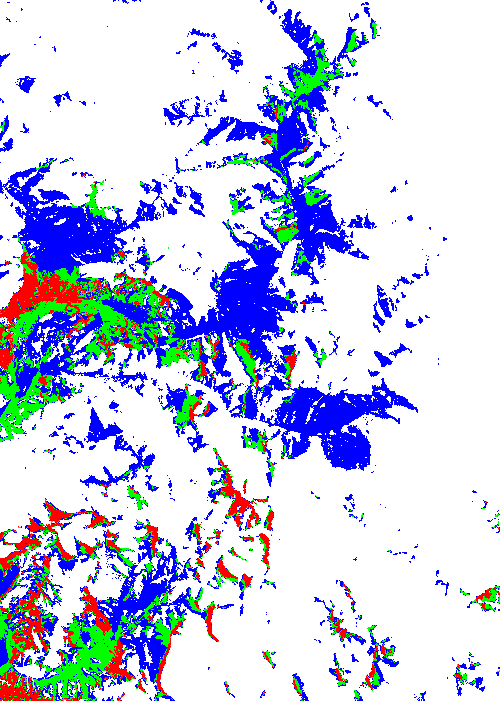
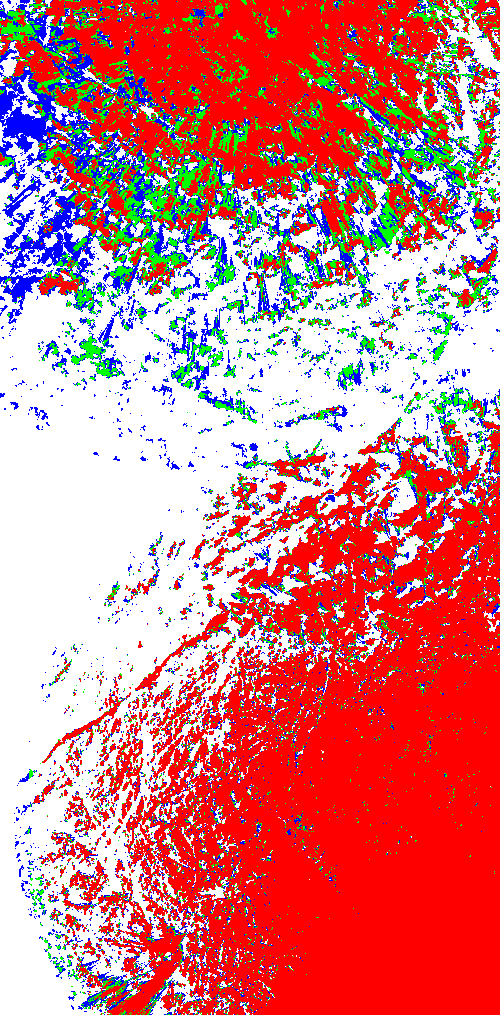
Merge overlapping images
If two (or more) images overlap then we need to sum coverages, which means to merge “green” areas:
convert -composite image1.png image2.png result.png


Add Geographical data into images
This can be done with a single command as soon as you know the corners coordinates (here in WGS 84)
gdal_translate -of GTiff -a_ullr 1 47 2 46 -a_srs EPSG:4326 input.png output.tif
To check that image is correctly positionned use QGIS, add a raster layer and select output.gif.
Remove geotiff RGB palette
After all this operations you will have a RGB tiff with palette and we need to remove it. Otherwise you can’t build image pyramid (following section commands will fail with errors).
gdal_translate -expand rgb input.tif output.tif
You can see that the palette was removed with file command :
$ file input.tif
input.tif: TIFF image data, little-endian, direntries=18, height=689, bps=8, compression=none, PhotometricIntepretation=RGB Palette, width=500

$ file output.tif
output.tif: TIFF image data, little-endian, direntries=16, height=689, bps=206, compression=none, PhotometricIntepretation=RGB, width=500
Build an Image pyramid from Geotiff images
Geoserver raster input is quite basic: it can load a single geotiff in a data store.
I have hundreds of geotiff. I could merge them into a giant single one but loading it will eat a loooot of RAM and is not elegant or even practicable.
The way I load it into geoserver is using an “Image pyramid”. This require a geoserver plugin but this gives good results.
If you know better methods please put it in the comment :-)
The command for building a pyramid is “gdal_retile”, but there is some deformation if you use it directly if youre images are not contiguous.
To avoid deformation you’ll need to prepare a clean GDAL referential (a VRT file):
You can select tif files one by one or with *.tif but for a great number of image shell buffer will be overflowed
gdalbuildvrt -input_file_list tilelist.txt world.vrt
Then you can build the pyramid from your the VRT.
gdal_retile.py -v -r bilinear -levels 1 -ps 2048 2048 -co "TILED=YES" -co "COMPRESS=JPEG" -targetDir ./coverage_tiles world.vrt
When done you have an image pyramid in the directory “coverage_tiles”.
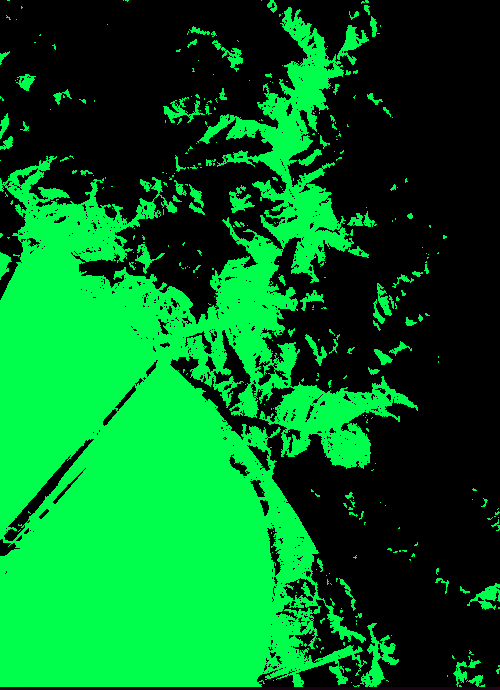
Transform images in pyramid into 1 color band images
This step is required by geoserver because it can’t style raster color with several color band.
Firstly we add alpha channel to change from RGB to RGBA:
gdal_translate -b 1 -b 2 -b 3 -b mask source.tif rgba.tif
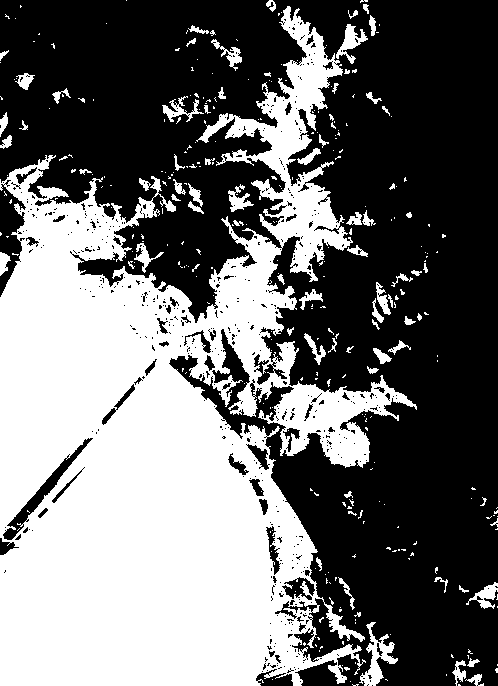
Secondly, we keep only band number 2 (our green color) and put it into a one band image (black and white):
gdal_translate -b 2 rgba.tif gray.tif
This is the result :
You can see differences with file command :
$file rgba.tif
rgba.tif: TIFF image data, little-endian, direntries=17, height=689, bps=218, compression=none, PhotometricIntepretation=RGB, width=500

$ file gray.tif
gray.tif: TIFF image data, little-endian, direntries=16, height=689, bps=8, compression=none, PhotometricIntepretation=BlackIsZero, width=500
You can see in depth channel status with gdalinfo command:
$ gdalinfo source.tif
Driver: GTiff/GeoTIFF
Files: source.tif
Size is 500, 689
Coordinate System is:
GEOGCS["WGS 84",
    DATUM["WGS_1984",
        SPHEROID["WGS 84",6378137,298.257223563,
            AUTHORITY["EPSG","7030"]],
        AUTHORITY["EPSG","6326"]],
    PRIMEM["Greenwich",0],
    UNIT["degree",0.0174532925199433],
    AUTHORITY["EPSG","4326"]]
Origin = (1.000000000000000,47.000000000000000)
Pixel Size = (0.002000000000000,-0.001451378809869)
Metadata:
  AREA_OR_POINT=Area
Image Structure Metadata:
  INTERLEAVE=PIXEL
Corner Coordinates:
Upper Left  (   1.0000000,  47.0000000) (  1d 0' 0.00"E, 47d 0' 0.00"N)
Lower Left  (   1.0000000,  46.0000000) (  1d 0' 0.00"E, 46d 0' 0.00"N)
Upper Right (   2.0000000,  47.0000000) (  2d 0' 0.00"E, 47d 0' 0.00"N)
Lower Right (   2.0000000,  46.0000000) (  2d 0' 0.00"E, 46d 0' 0.00"N)
Center      (   1.5000000,  46.5000000) (  1d30' 0.00"E, 46d30' 0.00"N)
Band 1 Block=500x5 Type=Byte, ColorInterp=Red
Band 2 Block=500x5 Type=Byte, ColorInterp=Green
Band 3 Block=500x5 Type=Byte, ColorInterp=Blue
$gdalinfo rgba.tif
Driver: GTiff/GeoTIFF
Files: rgba.tif
Size is 500, 689
Coordinate System is:
GEOGCS["WGS 84",
    DATUM["WGS_1984",
        SPHEROID["WGS 84",6378137,298.257223563,
            AUTHORITY["EPSG","7030"]],
        AUTHORITY["EPSG","6326"]],
    PRIMEM["Greenwich",0],
    UNIT["degree",0.0174532925199433],
    AUTHORITY["EPSG","4326"]]
Origin = (1.000000000000000,47.000000000000000)
Pixel Size = (0.002000000000000,-0.001451378809869)
Metadata:
  AREA_OR_POINT=Area
Image Structure Metadata:
  INTERLEAVE=PIXEL
Corner Coordinates:
Upper Left  (   1.0000000,  47.0000000) (  1d 0' 0.00"E, 47d 0' 0.00"N)
Lower Left  (   1.0000000,  46.0000000) (  1d 0' 0.00"E, 46d 0' 0.00"N)
Upper Right (   2.0000000,  47.0000000) (  2d 0' 0.00"E, 47d 0' 0.00"N)
Lower Right (   2.0000000,  46.0000000) (  2d 0' 0.00"E, 46d 0' 0.00"N)
Center      (   1.5000000,  46.5000000) (  1d30' 0.00"E, 46d30' 0.00"N)
Band 1 Block=500x4 Type=Byte, ColorInterp=Red
  Mask Flags: PER_DATASET ALPHA
Band 2 Block=500x4 Type=Byte, ColorInterp=Green
  Mask Flags: PER_DATASET ALPHA
Band 3 Block=500x4 Type=Byte, ColorInterp=Blue
  Mask Flags: PER_DATASET ALPHA
Band 4 Block=500x4 Type=Byte, ColorInterp=Alpha
$ gdalinfo gray.tif
Driver: GTiff/GeoTIFF
Files: gray.tif
       gray.tif.aux.xml
Size is 500, 689
Coordinate System is:
GEOGCS["WGS 84",
    DATUM["WGS_1984",
        SPHEROID["WGS 84",6378137,298.257223563,
            AUTHORITY["EPSG","7030"]],
        AUTHORITY["EPSG","6326"]],
    PRIMEM["Greenwich",0],
    UNIT["degree",0.0174532925199433],
    AUTHORITY["EPSG","4326"]]
Origin = (1.000000000000000,47.000000000000000)
Pixel Size = (0.002000000000000,-0.001451378809869)
Metadata:
  AREA_OR_POINT=Area
Image Structure Metadata:
  INTERLEAVE=BAND
Corner Coordinates:
Upper Left  (   1.0000000,  47.0000000) (  1d 0' 0.00"E, 47d 0' 0.00"N)
Lower Left  (   1.0000000,  46.0000000) (  1d 0' 0.00"E, 46d 0' 0.00"N)
Upper Right (   2.0000000,  47.0000000) (  2d 0' 0.00"E, 47d 0' 0.00"N)
Lower Right (   2.0000000,  46.0000000) (  2d 0' 0.00"E, 46d 0' 0.00"N)
Center      (   1.5000000,  46.5000000) (  1d30' 0.00"E, 46d30' 0.00"N)
Band 1 Block=500x16 Type=Byte, ColorInterp=Green
Loading images into Geoserver
I won’t detail here how to do this but basically:
- Load pyramid into a store (you need the image pyramid plugin)
- Create a layer from that store
- Create a style for that layer
- Merge the layer with other one in a layer group (if you need it)
- Youre WMS service is ready
Here it is the SLD style I use:
<?xml version="1.0" encoding="UTF-8"?>
<StyledLayerDescriptor version="1.0.0"
 xsi:schemaLocation="http://www.opengis.net/sld StyledLayerDescriptor.xsd"
 xmlns="http://www.opengis.net/sld"
 xmlns:ogc="http://www.opengis.net/ogc"
 xmlns:xlink="http://www.w3.org/1999/xlink"
 xmlns:xsi="http://www.w3.org/2001/XMLSchema-instance">
  <NamedLayer>
    <Name>Sigfox coverage</Name>
    <UserStyle>
      <Title>Fantastic Raster</Title>
      <Abstract>A kickass style</Abstract>
      <FeatureTypeStyle>
        <Rule>
          <Name>Coverage colorisation</Name>
          <Title>Opaque Raster</Title>
          <RasterSymbolizer>
            <ChannelSelection>
              <GreenChannel>
                 <SourceChannelName>1</SourceChannelName>
              </GreenChannel>
            </ChannelSelection>
            <ColorMap>
              <ColorMapEntry color="#000000" quantity="0" opacity="0"/>
              <ColorMapEntry color="#00DFFF" quantity="250" opacity="1"/> <!-- there is some noise in images and I need to display only plain color areas -->
              <ColorMapEntry color="#00DFFF" quantity="256" opacity="1"/>
            </ColorMap>
            <Opacity>0.7</Opacity> <!-- you can tune transparency here -->
          </RasterSymbolizer>
        </Rule>
      </FeatureTypeStyle>
    </UserStyle>
  </NamedLayer>
</StyledLayerDescriptor>
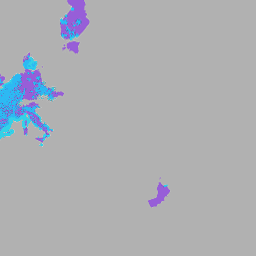
Before merging, the is the OpenLayer preview embedded in geoserver:
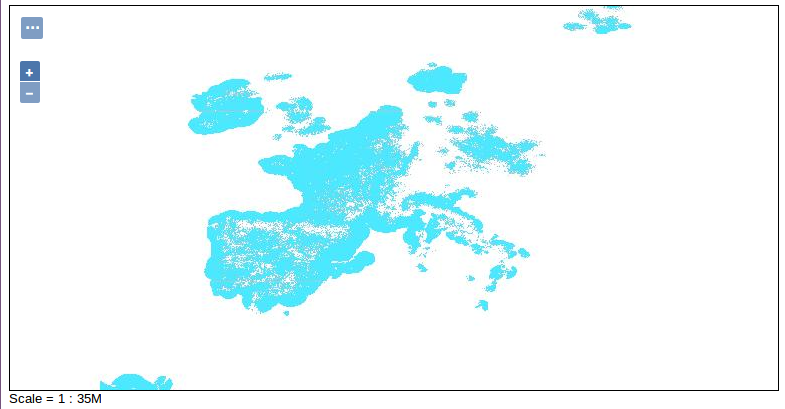
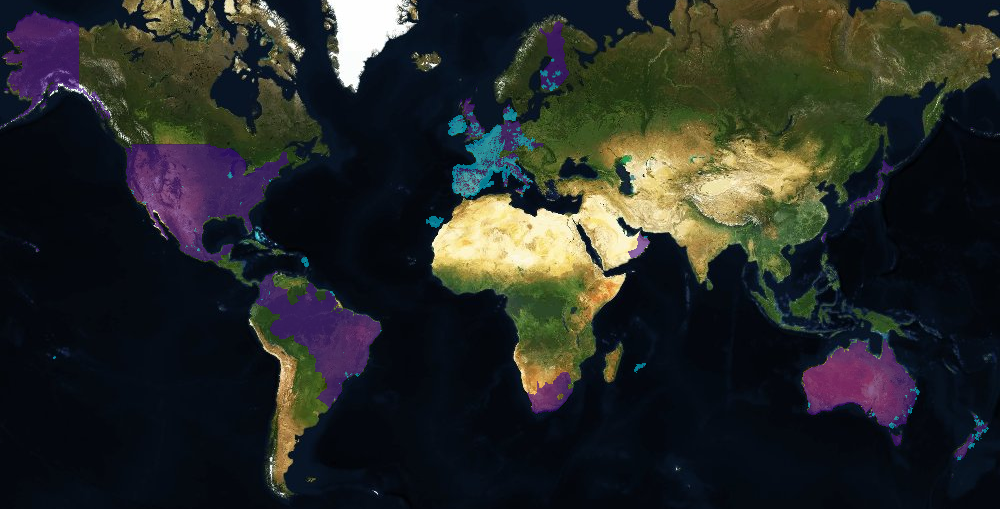
Finalize layer style: apply final color, merge with other layers
After merging with a country layer and a black overlay, this is the preview in OpenLayers :
Build TMS directory tree with Mapproxy
Now my favorite part (I am a mapproxy fan!), create TMS directory with mapproxy.
You need to define WMS source from geoserver previous URL and define a cache.
This is my config file :
services:
  demo:
  tms:
    use_grid_names: true
    # origin for /tiles service
    origin: 'sw'
  wmts:
    kvp: false
    restful: true

layers:
  - name: sigfox_cached
    title: Layer of coverage map www.sigfox.com
    sources: [sigfox_cache]

caches:
  sigfox_cache:
    grids: [g]
    sources: [geoserver]
    meta_size: [2, 2]
    meta_buffer: 1
    image:
      resampling_method: bilinear
      encoding_options:
        quantizer: mediancut
    cache:
      type: file
      directory_layout: tms

sources:
  geoserver:
    type: wms
    supported_srs: ['EPSG:4326']
    coverage:
      bbox: [-180,-90, 180,90]
      srs: 'EPSG:4326'
    req:
      url: http://127.0.0.1:8080/geoserver/sigfox-www/wms?
      layers: www.sigfox.com
      transparent: true
      format: image/png

grids:
    webmercator:
        base: GLOBAL_WEBMERCATOR
    g:
        base: GLOBAL_WEBMERCATOR
        srs: 'EPSG:900913'
        origin: 'nw'
globals:
  cache:
    # where to store the cached images
    base_dir: '/home/mapproxy/data'
  image:
    # without this mapproxy will simplify colors
    paletted: false
You can try your configuration launching mapproxy with integrated demo:
mapproxy-util serve-develop -b 127.0.0.1:7070 mapproxy.yaml
If OK, you need to use seeding to fill your data directory.
My seed file
seeds:
  sigfox.com:
    caches: [sigfox_cache]
    levels:
      to: 8
Launch seeding (this could be very long).
mapproxy-seed -f mapproxy.yaml -c 1 sigfox-seed.yml
I restrict mapproxy to one core only because I need to code during this time and I won’t freeze my laptop
Serve tile from this directory with NGINX
Copy your TMS directory into your NGINX server.
Self evident step : no need for comment
Built a leaflet map displaying the map in a webpage
Here it i a sample source code with a background and our layer: (I put leaflet fullscreen to impress girls)
<!doctype html>
<html lang="en">
    <head>
        <meta charset="utf-8">
        <meta http-equiv="X-UA-Compatible" content="IE=edge">
        <meta name="viewport" content="initial-scale=1,user-scalable=no,maximum-scale=1,width=device-width">
        <meta name="mobile-web-app-capable" content="yes">
        <meta name="apple-mobile-web-app-capable" content="yes">
        <link rel="stylesheet" href="css/leaflet.css" />
        <script src="js/leaflet.js"></script>
	<script src="js/fullscreen.js"></script>
	<link href="fullscreen.css" rel='stylesheet' />
        <style>
        #map {
            width: 1495px; /* no comment please :-) */
            height: 946px;
        }
        </style>
        <title>Sigfox Coverage Map</title>
    </head>
    <body style="margin:0">
        <div id="map">
        </div>
        <script>
        var map = L.map('map', {
	    fullscreenControl: true,
            zoomControl:true, maxZoom:11, minZoom:2
        }).fitBounds([[-86.1470045707,-25.4178198294],[85.3557580817,96.7495531352]]);

        bgLayer = L.tileLayer('https://whatyouwant.com/{z}/{x}/{y}');
        bgLayer.addTo(map);

	overlay = L.tileLayer('http://my/nginx/server/url/{z}/{x}/{y}.png',{maxNativeZoom:8});
	overlay.setOpacity(0.6);
        overlay.addTo(map);
        </script>
    </body>
</html>
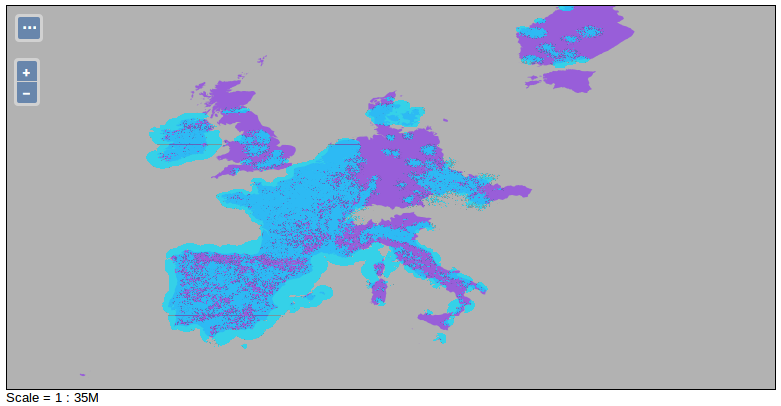
And TADAAAA :